NETBRAIN

NETBRAIN

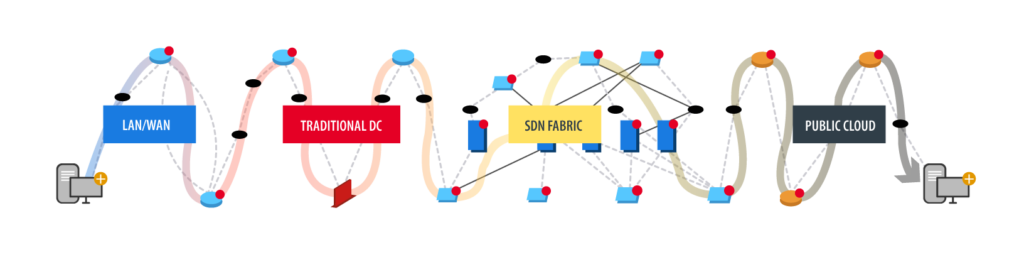
Government organizations consistently face the challenge of out of date network documentation and tribal knowledge among staff and consultants. Networks are also extending into the cloud where an end-to-end understanding of traffic flow is difficult to understand from disparate tools and dashboards. These issues impact network operations’ ability to quickly respond and remediate performance issues and outages.


In order for IT Operations to maintain the same levels of uptime and service, they require better visibility to respond to issues across the hybrid infrastructure. For the Government’s large and dynamic environments, manual methods of documentation is not sufficient…automation is a must

A typical enterprise may experience thousands of IT events daily – many of these are urgent, and all require manual efforts, causing longer resolution times. Click Networks’ real-time dynamic mapping solutions enhance the ability to reduce mean time to repair by applying automation in three phases during incident response:

Triggered Automation – before a human intervention

Interactive Automation – during active troubleshooting

Proactive Automation – after the issue is resolved

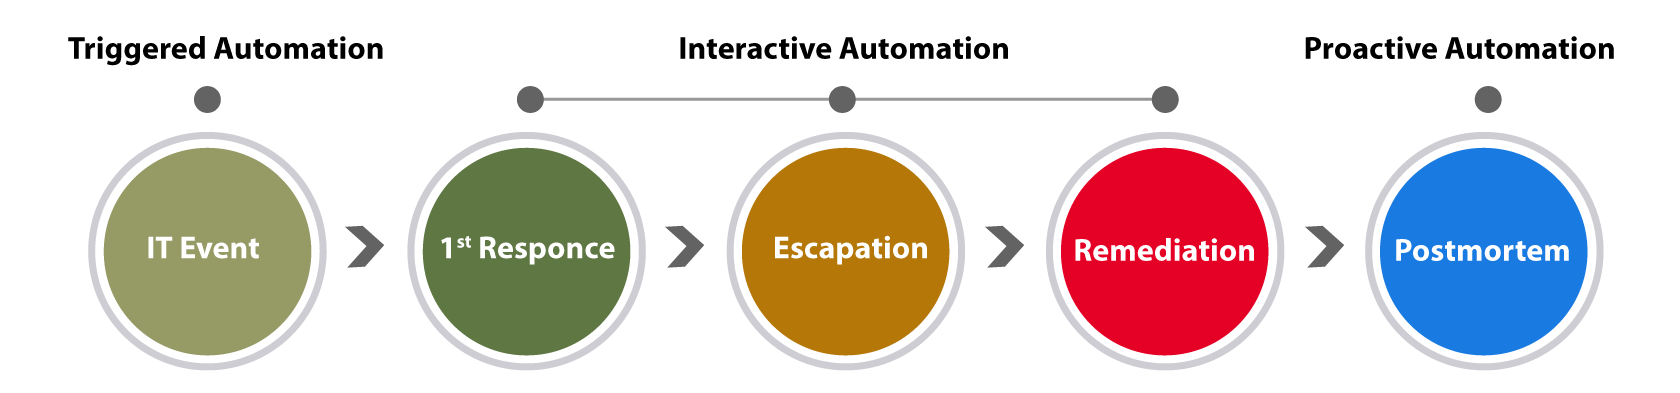
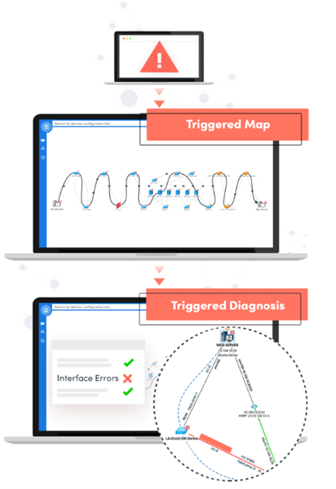
1. TRIGGERED AUTOMATION

A critical phase of troubleshooting is the initial response and diagnosis. Since these first steps are predictable, we believe every IT problem investigation should begin with “zero touch” or triggered automation.

The instant an event is detected, the platform’s automation provides two essential functions:


  1. Map the problem area dynamically
  2. Execute triage diagnostics

By applying Triggered Automation during incident response, we close the gap between the detection of a fault and the action of diagnosing.

Triggered by an event, we can automatically
create a map of the relevant part of the
network. This helps to provide visualization across the infrastructure. A URL of the Dynamic Map is returned to your ITSM for quick access by anyone investing in the event.

The platform provides automation mechanisms to quickly scrape through volumes of data such as CLI outputs, device configurations, and network telemetry. This automation is fully customizable, so you can organize common troubleshooting procedures into repeatable procedures called Executable Runbooks.

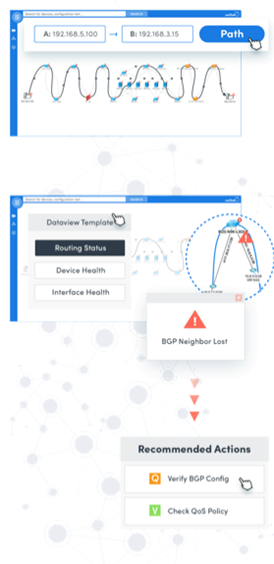
2. INTERACTIVE AUTOMATION

Interactive Automation is designed to augment an engineer’s workflow – even for complex multi-stage efforts. A Dynamic Map is the user interface for automation, as an alternative to a CLI.

When an engineer first arrives on the scene to troubleshoot, there are a set of common questions they usually ask. We offer a set of tools to help answer these questions


  1. What’s changed in the network?
  2. Is the network in a normal or abnormal state?
  3. What should I do next?

Data View Templates put virtually any network data at your team’s finger tips. Clicking a Data View dynamically turns on and off layers of data on top of a Dynamic Map, making it easy to visualize the network from different perspectives.


Data Views not only display raw data, but also flag abnormalities in that data, across thousands of parameters. For example, the Golden Baseline may indicate that a BGP router should normally have four active neighbors. If that router loses a neighbor, this would raise as an alert on the map which may be a clue to something wrong.

Troubleshooting is often a team event so there is a need to get timely resource alignment across groups, to reduce redundancy and improve efficiency. Contained within a single URL is a Dynamic Map of the area under investigation and all troubleshooting steps performed against it. This troubleshooting record is documented automatically. As teams troubleshoot collaboratively, they can share this URL. This ability to get teams on the same page, facilitates better handoffs and avoids duplication of work.

Quickly restoring business services is the primary goal of incident response, but deploying a fix introduces risk of collateral damage. It is critical to effectively resolve outages while also mitigating risk during problem remediation. From design, to implementation, to verification, the Change Management module automates the entire change management process. Users can push complex changes to multiple devices simultaneously and even integrate with tools such as Ansible. Application Assurance Engine helps to quickly assess and visualize the impact of a change on the network, and the applications running upon it. If any problems are discovered within the change window, a user can roll back to the previous state with one-click

3. PROACTIVE AUTOMATION

Desiring to “do better next time”, world class operations teams leverage the post-mortem review – to determine how to prevent or reduce the impact of a similar problem in the future. Unfortunately, the success of such endeavors is fraught with difficulties applying these lessons at scale. The goal of Proactive Automation is to codify lessons learned from every incident and translate them into automation tasks which can be leveraged by the broader team in the future.

With our platform, all diagnostic steps and data from a given incident are preserved inside a runbook for review. The task of documenting the troubleshooting process occurs simultaneously and automatically. This documentation is invaluable to help teams identify how they can continually improve.

The process by which a team empowers junior engineers to minimize escalations is known as “shifting workloads left”. When engineers document their workflows and share them as Executable Runbooks, it makes this goal much more attainable. Executable Runbooks can be shared with the team, in the form of Interactive Automation, by offering them as “Recommended Actions” during troubleshooting. The same runbooks can be shifted even further left and configured to execute with zero human touch via Triggered Automation. Either way, shifting know-how and workloads to the left frees up senior network engineers and continuously reduces MTTR.


Share by: